24-hour hotline:+8613662168047
Keyword search: battery plant , lithium battery factory , power bank works , lifepo4 battery mill , Pallet Trucks LiFePO4 Battery, LiFePO4 Pallet Trucks Battery, Lithium Pallet Trucks Battery,
One of the advantages of fuel cells is high efficiency, which can use energy more efficiently. Now the research and development of fuel cell vehicles has lasted for quite a long time (the first fuel cell vehicle in the world was the Electrovan in 1966), and the fuel cell vehicles have also iterated a lot, so how about the efficiency and hydrogen consumption level of fuel cell vehicles? Here, Argonne Lab published a paper at the end of 2019 to summarize the efficiency, energy consumption level and hydrogen consumption of fuel cell vehicles. As a typical product, the data of Toyota Mirai (2016 model) can be used as a benchmark for fuel cell vehicle efficiency and energy consumption.
Definition of efficiency
Argonne defined three efficiencies in the evaluation of fuel cell vehicles: fuel cell stack efficiency, fuel cell system efficiency, and vehicle efficiency.
Stack efficiency: As shown in the figure above, the stack efficiency only considers the stack itself. The power generated from the beginning to the end of the calculation interval and the total flow of hydrogen consumed during the period (i.e. the total output energy of the reactor)/the energy released after the reaction of water generation (calculated according to the low calorific value).
System efficiency: as shown in the figure above, the system efficiency takes into account the power consumption brought by the stack and its related accessories. The power of the electric reactor minus the power of the auxiliary parts in the measurement range and (total output energy of the system)/the total flow of hydrogen consumed during the reaction to generate water and the energy released (calculated by the low calorific value).
Vehicle efficiency is a concept often used by fuel vehicles. The calculation formula is: the energy released after the reaction of the total flow rate of hydrogen consumed during the normal working condition defined in SAE J2951 to generate water (calculated according to the low calorific value).
According to SAE J2951 definition, since positive energy is not defined in the standard on fuel cell vehicles, negative energy can be viewed in reverse here. Negative energy is the energy loss caused by braking or reducing the road load work required by the engine during non-braking deceleration. For fuel cell vehicles, Xiao Bian understands that positive energy should include the energy output by the fuel cell system and the energy recovered. For pure battery vehicles, since the numerator is power generation rather than power consumption, this calculation formula may be more than 100%, so Xiaobian thinks it is not entirely reasonable to use this formula to evaluate electric vehicles.
According to the statistical data of EPA (U.S. Environmental Protection Agency), the comprehensive efficiency and energy consumption level of fuel cell vehicles under typical working conditions in recent years are shown in the following figure:
It can be seen that the efficiency of fuel cell vehicles has been greatly improved in recent 10 years. Take Honda as an example. From the early Honda FCX Clarity to the later Honda Clarity Fuel Cell, the FTP efficiency has increased from 54% to 67%, and the HWFET efficiency has increased from 51% to 57%. Honda, Toyota and Hyundai are the leaders of fuel cell vehicles. In this generation (around 2019), the efficiency of vehicles is very similar, and everyone's level is the same. But after all, the comprehensive efficiency of working conditions is derived from the statistics of the efficiency under all working conditions. For the development and evaluation of fuel cell vehicles, we also need a typical efficiency (efficiency power curve) at each power, or a benchmark as our reference to judge how our fuel cell vehicles are doing.
Typical efficiency-power curve of fuel cell vehicle (Mirai as benchmark)
Argonne used Mirai to carry out the following driving condition test. The test first includes three FTP-defined UUDS (The Urban Dynamometer Driving Schedule) driving conditions, which is a relatively mild urban driving condition, which can be seen from the speed below. Then the vehicle will run two high-speed conditions (HWFET) and two US06 conditions. HWFET is a standard test condition for fuel economy at high speed in the United States, while US06 is a fierce driving condition with high speed.
The test results are shown in the figure below. It can be seen that the more mild the working conditions are, the higher the efficiency of the fuel cell stack and fuel cell system is. The working conditions have a small impact on the stack efficiency, but a large impact on the system efficiency. Under intense US06 conditions, the efficiency of fuel cell stack is only about 3% lower than that of UDDS. However, the efficiency of fuel cell system decreased by nearly 23% due to the change of working conditions.
After summarizing the test results, Mirai's efficiency-power curve can be obtained. As shown in the figure below, it can be seen that the lower the power, the closer the fuel cell system efficiency is to the stack efficiency; The higher the power, the greater the difference between the fuel cell system efficiency and the stack efficiency. In the full power range, the maximum efficiency of the stack is 66%, while the maximum efficiency of the fuel cell system is 63.7%. At 25% stack power, the system efficiency is 58%, and the stack efficiency is about 61%. When the peak power is 114kW, the stack efficiency will drop to about 49%, while the system efficiency will only be about 40%. From the change of the efficiency curve of the air compressor and DCDC, we can see that the reduction of the system efficiency is mainly due to the reduction of the efficiency of DCDC and the rapid increase of the power consumption of the air compressor. Of course, the water pump and hydrogen pump will also increase some consumption, but these components have a small impact on the system efficiency because of their small power consumption.

Lithium Batteries ,Ensure Quality
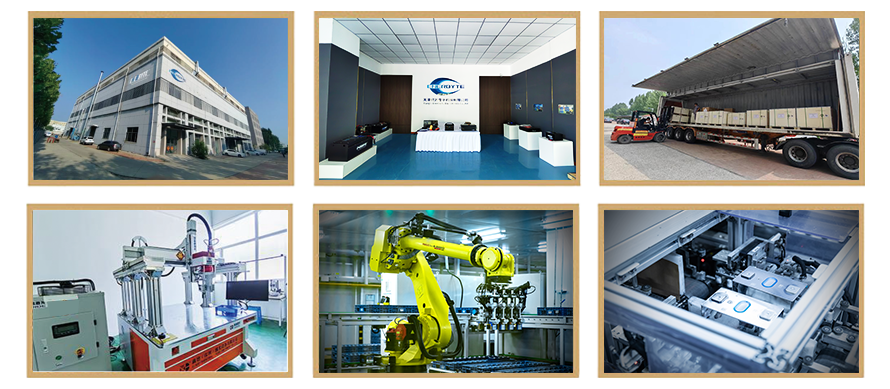
Our lithium battery production line has a complete and scientific quality management system
Ensure the product quality of lithium batteries
Years of experience in producing lithium batteries
Focus on the production of lithium batteries
WE PROMISE TO MAKE EVERY LITHIUM BATTERY WELL
We have a comprehensive explanation of lithium batteries
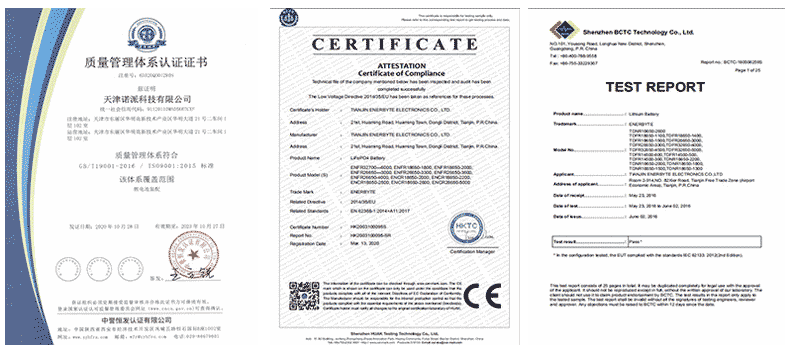
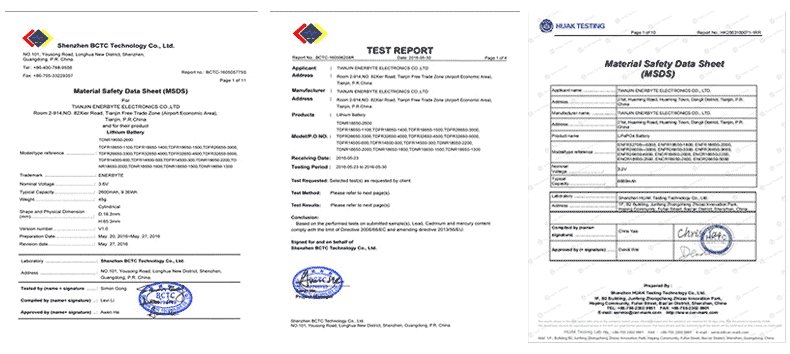
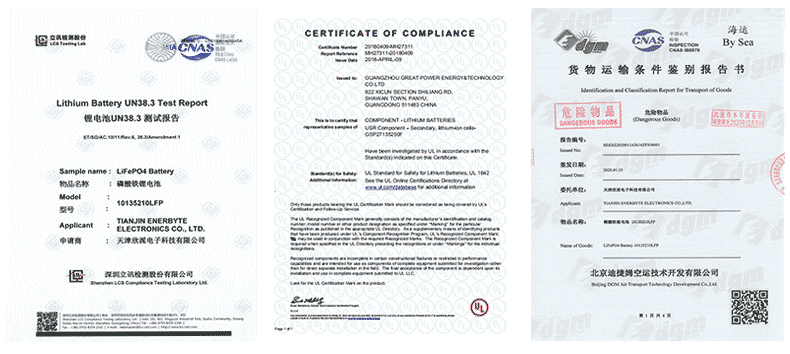
QUALIFICATION CERTIFICATE
THE QUALITY OF COMPLIANCE PROVIDES GUARANTEE FOR CUSTOMERS
MULTIPLE QUALIFICATION CERTIFICATES TO ENSURE STABLE PRODUCT QUALITY
Providing customers with professional and assured products is the guarantee of our continuous progress.

Applicable brands of our products


 Service hotline