24-hour hotline:+8613662168047
Keyword search: battery plant , lithium battery factory , power bank works , lifepo4 battery mill , Pallet Trucks LiFePO4 Battery, LiFePO4 Pallet Trucks Battery, Lithium Pallet Trucks Battery,
It is of great significance to study the low-temperature charging aging of lithium batteries and their charging control strategies in order to promote the promotion of new energy vehicles in cold regions. This work establishes a multi stress low-temperature charging aging model based on a large amount of low-temperature charging experimental data. Taking temperature as an important influencing factor, while considering the effects of charging cut-off voltage, charging rate, and charging cycle times on battery aging. Introducing the decay acceleration factor, multiple charging stresses were combined and applied to the overall model, and the estimation accuracy of the model was simulated and tested. On this basis, genetic algorithm is introduced to optimize the charging control strategy. Based on the charging voltage, the charging process before reaching the charging cut-off voltage is divided into multiple charging stages. The charging current in each stage is used as the gene sequence of the genetic algorithm, and the charging aging rate and charging time are used as optimization objectives for iterative optimization. The simulation results show that the established low-temperature charging aging model has high parameter estimation accuracy, and the charging control strategy can effectively reduce battery aging and save charging time. The charging strategy was experimentally tested using the designed charging controller, and the test results were consistent with the simulation results. The experiment on low-temperature charging of batteries has explored the law of the impact of low-temperature charging on battery life degradation. The experimental data, aging model, and charging strategy optimization method have direct reference value.
Keywords: lithium battery; Aging modeling; Genetic algorithm; Low temperature charging; Charging strategy
In recent years, new energy vehicles have developed rapidly, and lithium batteries have become the primary energy storage equipment for new energy vehicles due to their high specific energy, high specific power, low self discharge rate, no memory effect, and long charge discharge life. Replacing fossil fuels with green and environmentally friendly lithium batteries has become an important development direction. However, there are many problems with the charging of new energy vehicles at present. Most car mounted AC chargers and DC high-power charging piles use traditional charging strategies, which are not suitable for some countries or regions with colder climates, such as Beijing, Changchun and other places in China, where sub zero temperature weather often occurs. Although some new energy vehicles preheat the battery pack before charging in low-temperature environments, there are still issues such as uneven heating of the battery cells, battery inconsistency, energy waste, and long charging times. At present, there is relatively little research on the low-temperature charging aging and charging strategies of power lithium batteries in China. The long charging time and rapid degradation rate of charging life of lithium batteries at low temperatures are important factors restricting the development of electric vehicles in low-temperature areas.
Extensive research has been conducted both domestically and internationally on the lifespan degradation model of power lithium batteries at room temperature, modeling based on the electrochemical, thermal, and aging characteristics of the battery. From the perspective of analysis methods, it can be divided into electrochemical models, relevant empirical models, and data-driven models. Gao et al. conducted cycle life experiments on lithium batteries under different charging stresses to study the aging mechanism of lithium batteries under different charging stresses, and established a lithium battery charging capacity degradation model based on relevant empirical models. Johannes et al. established a mathematical model describing the effects of temperature and voltage on calendar aging of lithium batteries through data analysis. Simon et al. studied the aging process of nickel cobalt manganese oxide lithium batteries at different temperatures and charging rates, and established a P2D electrochemical model to describe lithium-ion charging aging. Research on charging strategies is currently divided into traditional charging strategies, traditional improved charging strategies, and charging strategies based on model optimization algorithms. The traditional charging strategy is mainly represented by CC-CV (constant current constant voltage), while the traditional improved charging strategy optimizes the charging time and effective charge amount based on the traditional charging strategy. Li Lizhen et al. used dynamic programming algorithm and Markov decision algorithm to find the optimal charging curve. Compared with the traditional CC-CV charging strategy, the effective charging capacity increased by 15%, and the equivalent cycle charging capacity of the battery decreased by 30%. Hsieh et al. established a fuzzy control active charging state controller, which improved charging performance by 23% compared to the traditional CC-CV charging process.
This article focuses on the influence of different charging stresses on the capacity degradation of lithium batteries in low-temperature environments. Charging data with different charging temperatures, cut-off voltages, and charging rates were obtained through extensive cyclic charging tests. After processing and analyzing the data, a mathematical model for multi stress charging aging of lithium batteries was established. The charging strategy of the entire charging process is divided into two stages. In the first stage, the terminal voltage of the battery during charging is used as the reference, and a genetic algorithm is used to optimize the charging current curve before reaching the charging cut-off voltage. The second stage is based on the first stage and converted to constant voltage charging. Finally, the charging strategy was validated through simulation and experimental testing.
Low temperature charging experiment of lithium battery
In order to make the experimental operation convenient and representative, and to map the aging law of actual automotive power lithium batteries, a ternary lithium battery with a size model of 18650, positive electrode material of nickel cobalt aluminum (NCA), and negative electrode material of traditional graphite was selected for charge discharge aging experiments. The battery parameters are shown in Table 1.
Table 1 Battery Parameters
Conduct charging experiments considering three influencing factors: charging temperature, charging cut-off voltage, and charging current rate. For the low temperature range of 0-20 ℃, select 5 temperature test points: 0 ℃, -5 ℃, -10 ℃, -15 ℃, and -20 ℃. Select 4.0V, 4.05V, 4.1V, 4.2V, and 4.25V as charging cut-off voltage test points, and 0.2C, 0.5C, and 1C as charging rate test points. Conduct multiple cyclic charge discharge aging experiments under three different charging stresses: charging temperature, cut-off voltage, and charging current. All experiments are low-temperature charging room temperature discharging experiments, charging in CC-CV mode at preset temperature, rate, and cut-off voltage until the charging current drops to 0.02C, and the charging ends. And the discharge adopts the standard discharge system, which is to discharge at 0.5C to 2.5V at 25 ℃. Due to the significant temperature difference between charging and discharging, the battery should be placed in a constant temperature box for 3 hours before charging and discharging to ensure that the temperature inside and outside the battery reaches the preset level.
Under the same testing conditions, the same battery is used for charging cycle aging testing, and the same batch of lithium batteries is used for comparative experiments under different working conditions. Before the experimental testing, consistency screening is conducted on the batch of experimental battery samples based on capacity, internal resistance, and open circuit voltage to ensure the reliability of the test data.
2. Low temperature charging data analysis and modeling
2.1 Experimental data analysis
2.1.1 The impact of different charging temperatures on battery capacity degradation
By analyzing the experimental data, the variation curve of battery capacity degradation with the number of charging cycles at different charging temperatures can be obtained, as shown in Figure 1.
Figure 1 Charging capacity degradation curve at different temperatures
From Figure 1, it can be seen that as the temperature decreases, the charging decay rate accelerates. At a charging temperature of -20 ℃, after only 10 charging cycles, the battery capacity deteriorates by nearly 20%.
2.1.2 The impact of different cut-off voltages on battery capacity degradation
The test data of battery cyclic charge discharge capacity degradation under different charging cut-off voltages are shown in Figure 2. It can be seen that when the charging cut-off voltage is 4V, the capacity degradation is first fast and then slow. The capacity degradation curve within the voltage range of 4.05V to 4.25V is relatively flat before 4 charging cycles, with a slope close to zero and a capacity degradation of<1%. After 4 charging cycles, the degradation suddenly intensifies and shows a linear upward trend.
Figure 2 Charging capacity degradation curve under different cut-off voltages
2.1.3 The impact of different charging rates on battery capacity degradation
The experimental data of battery capacity degradation with the number of charging cycles under different charging current rates is shown in Figure 3. From the graph, it can be seen that as the number of charging cycles increases, the degradation of battery capacity also increases linearly. As the charging rate increases, the slope of the rising curve gradually increases, indicating that the degradation rate of charging capacity increases with the increase of charging rate at different charging rates. The fastest addition speed is between 0.2 and 0.5C.
Figure 3: Charging Capacity Decline Curve at Different Current Ratios
2.2 Establishment of Capacity Decline Model
Through the experimental data of multi stress charging and discharging under different charging temperatures, cut-off voltages, and charging rates, it can be concluded that the influence of charging temperature>charging rate>charging cut-off voltage on the rate of capacity degradation of the lithium battery. Therefore, we established a capacity degradation model based on capacity degradation test data at different temperatures, with charging rate and charging cut-off voltage as auxiliary influencing factors. The mathematical expressions for the capacity degradation rate model under different charging stresses, named as the charging cut-off voltage acceleration factor AU and charging rate acceleration factor AI, are shown in equations (1) and (2). Where K is the capacity decay rate; θ is the equivalent number of charging cycles for the battery; T is the charging temperature ℃. K θ, T represents the degradation rate of charging capacity when the charging temperature is T and the equivalent number of charging cycles is θ.
Fit the capacity decay curves at different temperatures as shown in Figure 4. The fitting function is a power function as shown in equations (3) and (4).
Figure 4: Curve fitting of charging capacity degradation at different temperatures
From the fitting curve, it can be seen that each temperature test point has a high degree of fitting. Next, parameters a and b will be fitted, as shown in Figure 5. There is no obvious linear relationship between parameters a, b and temperature parameters. After squaring them, it can be seen from the fitted image that a (1/3) and b (1/3) have a high degree of fit to temperature.
Figure 5: Fitting curves of parameters a and b
So the expressions for parameters a, b and charging temperature can be obtained as equations (5) and (6).
Use the same method to fit the capacity degradation curve under different charging cut-off voltages. Due to the fact that the degradation curve of charging capacity is similar to the splicing of two straight lines under different charging cut-off voltages, it is considered to be segmented with 4 charging cycles as the dividing point. In the first paragraph, the slope of the fitted line is almost zero, indicating that the charging cut-off voltage has no effect on capacity degradation in the first paragraph. The fitting of the capacity decay curve in the second paragraph is shown in Figure 6.

Lithium Batteries ,Ensure Quality
Our lithium battery production line has a complete and scientific quality management system
Ensure the product quality of lithium batteries

Years of experience in producing lithium batteries
Focus on the production of lithium batteries

WE PROMISE TO MAKE EVERY LITHIUM BATTERY WELL
We have a comprehensive explanation of lithium batteries
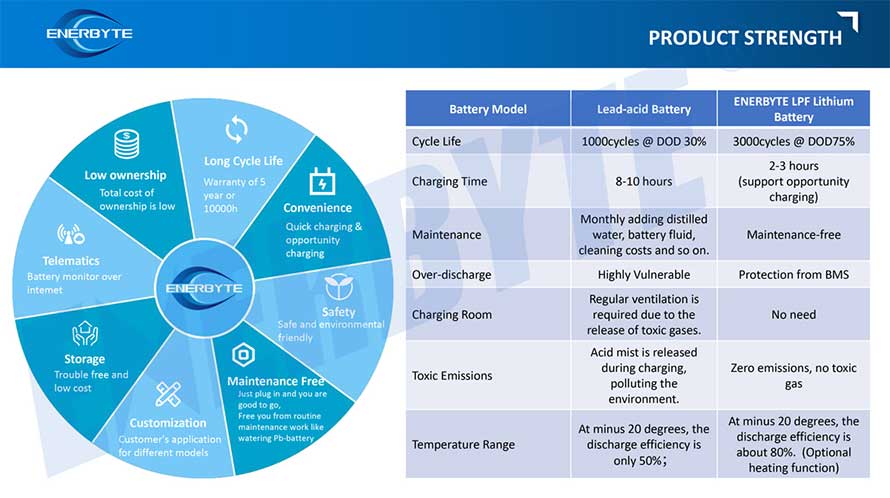
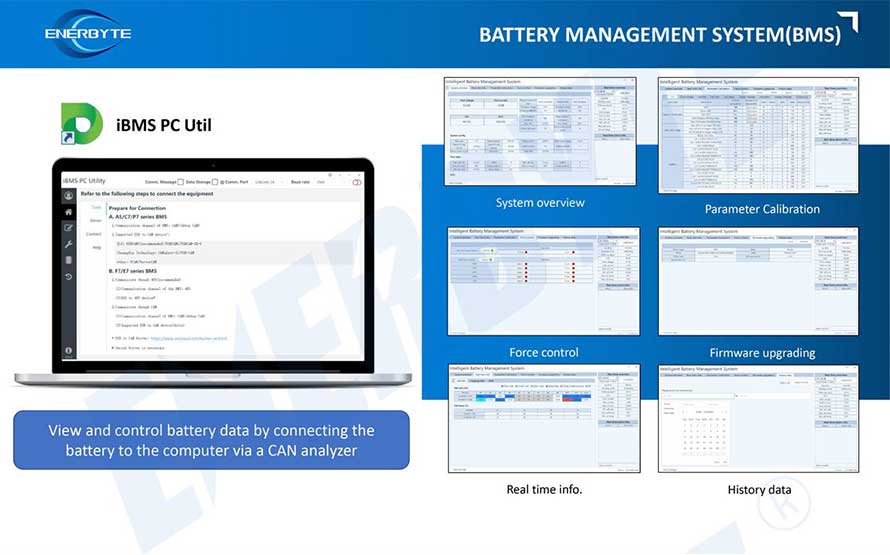
QUALIFICATION CERTIFICATE
THE QUALITY OF COMPLIANCE PROVIDES GUARANTEE FOR CUSTOMERS
MULTIPLE QUALIFICATION CERTIFICATES TO ENSURE STABLE PRODUCT QUALITY
Providing customers with professional and assured products is the guarantee of our continuous progress.
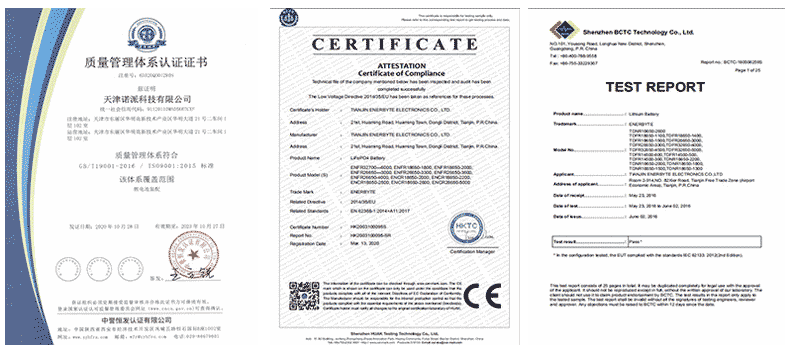

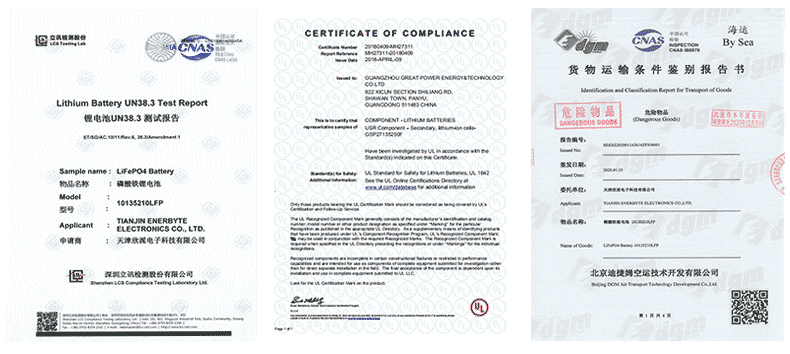

Applicable brands of our products


 Service hotline