24-hour hotline:+8613662168047
Keyword search: battery plant , lithium battery factory , power bank works , lifepo4 battery mill , Pallet Trucks LiFePO4 Battery, LiFePO4 Pallet Trucks Battery, Lithium Pallet Trucks Battery,
(2) Calculate the difference between the voltage of each module at the end of each charging of the battery pack and the voltage of each module at the end of the subsequent charging Δ U and compare with each other, select Δ The corresponding charging data with a smaller U value can be selected to prevent the relative charging time of each module during each charging process, as the voltage of each module at the end of charging remains basically unchanged when charging at the same current for two adjacent times Δ Tj fluctuates significantly;
(3) Count the module number that first reaches the cutoff voltage during each charging process of the battery pack, and select the corresponding charging data with the same module number from all charging data. The charging capacity of a battery pack depends on the module that first reaches the charging cut-off voltage. As the module that first reaches the cut-off charging voltage changes, the charging capacity and time of the battery pack also change. At the end of charging, the voltage of each module will change significantly, resulting in a relative charging time Δ Tj fluctuates significantly; If the charging data of the battery pack still meets the data selection principles (1) to (2) after the module that first reaches the cut-off charging voltage changes, the corresponding data will be retained.
The battery pack can be charged and discharged normally in the first two tests, but cannot be charged or discharged in the later stage of the third test. As shown in Figure 2, in the third test of the battery pack, there was an abnormality in the voltage curve of each module's cyclic charging and discharging after the 29th charge. Due to the modules in the battery pack reaching the charging and discharging cut-off voltages in a short period of time, the battery pack was unable to charge and discharge normally. Therefore, select the first 28 charging data of the battery pack for analysis, and select the charging data that meets the data selection principles (1) to (3) from the 28 charging data.
Figure 2 Voltage curves of each module in the third test
Figure 3 shows the charging capacity of the battery pack during three tests. The difference between each charging capacity and the subsequent charging capacity is calculated based on each charging capacity Δ C. The difference curve of charging capacity in the three tests is shown in Figure 4, with the vertical axis representing the difference in charging capacity between adjacent times and the horizontal axis representing the corresponding number of adjacent times of charging. In the third test, the charging capacity value changed slightly during the last two tests, Δ C is basically maintained within ± 2A · h. At -2A · h ≤ Δ C ≤ 2A · h is the condition for selecting charging data, and combined with Figure 3 and Figure 4, select the 2nd, 3rd, 6-9th charging data in Test 1, all data in Test 2, and the 19th to 25th, and 27th charging data in Test 3.

Lithium Batteries ,Ensure Quality
Our lithium battery production line has a complete and scientific quality management system
Ensure the product quality of lithium batteries

Years of experience in producing lithium batteries
Focus on the production of lithium batteries
WE PROMISE TO MAKE EVERY LITHIUM BATTERY WELL
We have a comprehensive explanation of lithium batteries
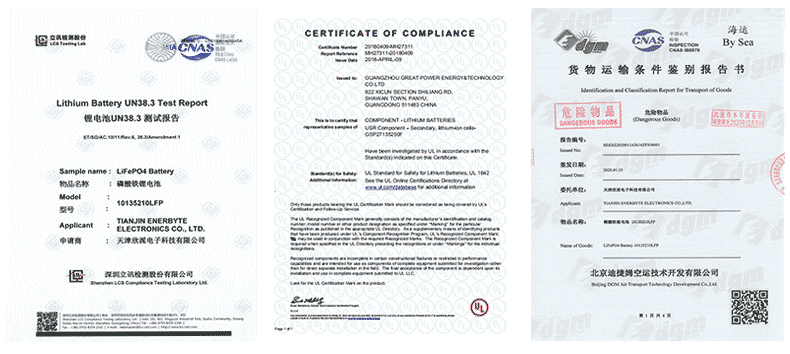
QUALIFICATION CERTIFICATE
THE QUALITY OF COMPLIANCE PROVIDES GUARANTEE FOR CUSTOMERS
MULTIPLE QUALIFICATION CERTIFICATES TO ENSURE STABLE PRODUCT QUALITY
Providing customers with professional and assured products is the guarantee of our continuous progress.



Applicable brands of our products


 Service hotline